
Official Data shows Children are up to 52 times more likely to die following Covid-19 Vaccination than Unvaccinated Children & the ONS is trying to hide it
Back on 20th Dec 21, the Office for National Statistics (ONS) published a dataset containing details on ‘deaths by vaccination status in England’ between 1st Jan and 31st Oct 21.
The dataset contains various tables showing details such as, ‘Monthly age-standardised mortality rates by vaccination status for deaths involving COVID-19’, and ‘Monthly age-standardised mortality rates by vaccination status for non-COVID-19 deaths’.
What the dataset also includes is ‘age-standardised mortality rates by age-group and vaccination status for all deaths’, however they have conveniently left out the data for children, and only included data on age groups over the age of 18.
What they also did in the data they included is bunch all young adults together meaning the rates of death are calculated for 18-39 year-olds, a total of 22 years. But for every other age group the rates of death are calculated for a total of 10 years, with 40-49, 50-59 etc.
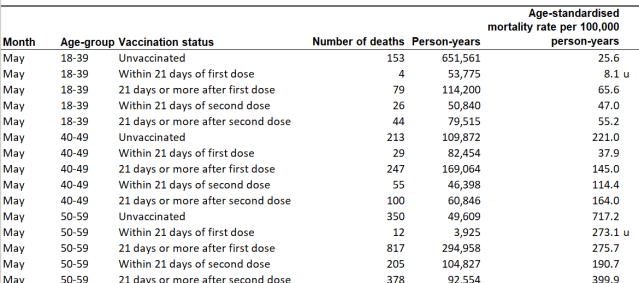
However, on table 9 of the ‘Deaths by Vaccination Status’ dataset, the ONS have inadvertently provided enough details on deaths among children and teenagers by vaccination status for us to calculate the mortality rates ourselves, and to put it bluntly, they are horrifying, and make it obvious as to why the ONS chose to exclude children from the mortality rates dataset.
What the ONS have done, as can be seen in the above table, is provide an age standardised mortality rate per 100,000 person-years, rather than per 100,000 population.
The reason for this is that the size of each vaccination status population has been changing all the time, due to the unvaccinated moving into the one-dose category, and the one-dose vaccinated moving into the two-dose vaccinated category throughout the year.
So by doing it this way it provides a much more accurate picture of the mortality rates because it accounts both the number of people and the amount of time a person has spent in each vaccination status.
And on table 9, the ONS have provided us with the number of deaths by vaccination status among children and teenagers, and have kindly also provided us with the person-years, meaning we can calculate the mortality rate per 100,000 person years for 10-14 year olds, and 15-19 year olds by vaccination status.
According to the ONS, between 2nd January and 31st October 2021 there were 96 deaths recorded among 10-14-year-olds who had not been vaccinated, and 160 deaths recorded among 15-19-year-olds who had not been vaccinated.

The ONS have calculated the person-years among unvaccinated 10-14 year-olds during this period to be 2,094,711, whilst they’ve calculated person-years among unvaccinated 15-19 year-olds during this period to be 1,587,072.
To work out the mortality-rate per 100,000 person years all we need to now do is divide the person-years by 100,000, and then divide the number of deaths by the answer to that equation.
So for 10-14 year-olds we perform the following calculation –
2,094,711 (person-years) / 100,000 = 20.94711
96 (deaths) / 20.94711 = 4.58
Therefore, the mortality rate per 100,000 person-years among unvaccinated 10-14-year-olds is 4.58 deaths per 100,000 person-years between 1st Jan and 31st Oct 21.
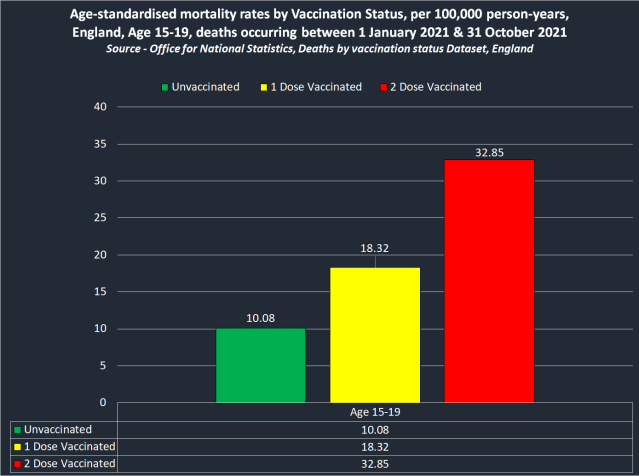
By using the same formula we find that the the mortality rate among unvaccinated 15-19-year-olds is 10.08 deaths per 100,000 person-years.
Now all we have to do is use the same formula to calculate the mortality rate among one-dose vaccinated and two dose vaccinated 10-14, and 15-19 year-olds, by using the person-years and number of deaths provided by the ONS in table 9 of their ‘Deaths by Vaccination Status’ report, which are as follows –


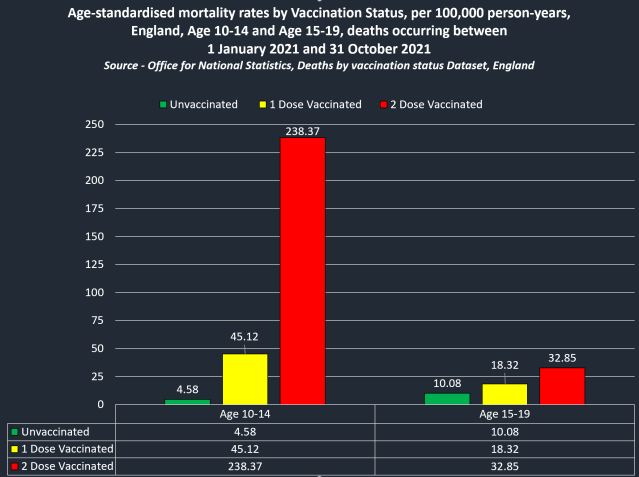
Here are the calculated mortality rates by vaccination status among 15-19-year-olds based on the ONS calculated person-years –
And here are the calculated mortality rates by vaccination status among 10-14-year-olds based on the ONS calculated person-years –
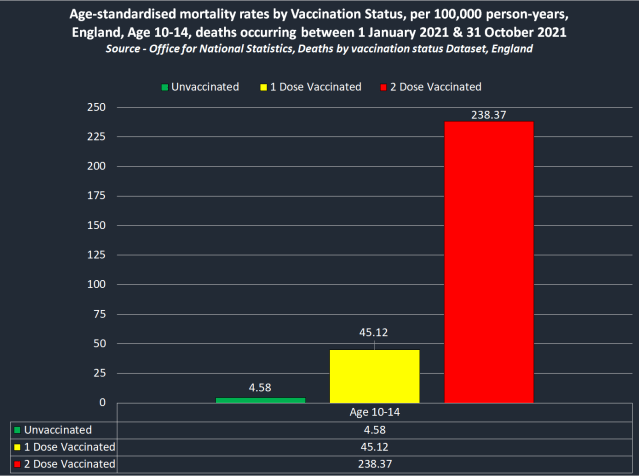
These figures are horrifying. The ONS data shows that between 1st Jan and 31st Oct 21, children aged 10-14 were statistically 10 times more likely to die than unvaccinated children, and teenagers aged 15-19 were statistically 2 times more likely to die than unvaccinated teenagers.
But it’s the double vaccinated figures that are truly frightening.
The ONS data shows that between 1st Jan and 31st Oct 21, teenagers aged 15-19 were statistically 3 times more likely to die than unvaccinated teenagers, but children aged 10-14 were statistically 52 times more likely to die than unvaccinated children, recording a death rate of 238.37 per 100,000 person years.
But these figures are in fact even worse than they first appear, as if they weren’t already bad enough. This is because the unvaccinated mortality rate among 10-14-year-olds includes children aged 10 and 11 who are not eligible for vaccination.
Whereas the vaccinated mortality rates do not include 10 and 11 year olds because they were not eligible for vaccination at the time, with the JCVI only recently recommending on 22nd Dec 21 that 5 to 11-year-old children deemed to be high risk should be offered a Covid-19 vaccination.
Therefore, if the Covid-19 injections were not causing the untimely deaths of children then we would actually expect to see a mortality rate that is lower among the vaccinated population than the mortality rate among the unvaccinated population, not a mortality rate that is similar, and certainly not a mortality rate 52 times higher.
This jaw dropping and horrifying data should be national headline news, and we dread to think what the numbers will be in the next update from the ONS which will include data on millions of more children who received their 1st and 2nd dose of a Covid-19 vaccine after October 31st 2021.